nyenr.elections.ny.gov : New York Primary Election Results 2020
| You can now ask your questions about this election. Please go to the bottom of this page. |
|---|
Organisation : New York State Board of Elections
Announcement : NY New York Primary Election Results 2020 (24th June 2020)
Province : New York
Country : United States of America
Website : https://www.elections.ny.gov/
New York Primary Election Results
United States Presidential Primary Election Results 2020 Live
New York Primary and Special Election 2020
New York Primary Election
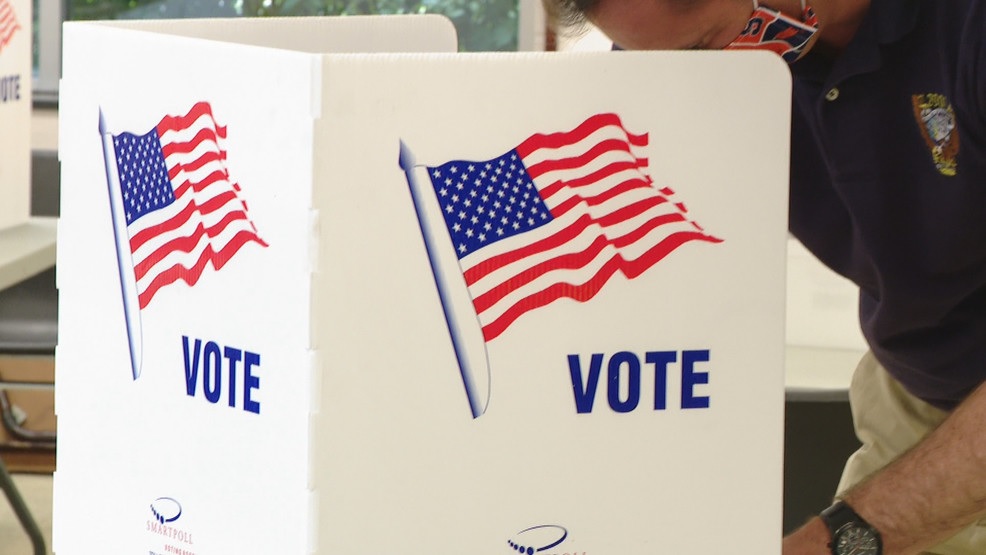
Today is Primary Election Day throughout New York. Polls are open everywhere from 6am to 9pm. There is also a Special Election to fill a vacancy in Congressional District 27 (Counties: Genesee, Livingston, Orleans, Wyoming, part of Erie, Monroe, Niagara and Ontario).
Unofficial Election Night Results
Welcome to the New York State Board of Elections Election Night Reporting Page. Please be advised that the polls in New York State close at 9 PM. It may take some time after 9 PM for results to begin to appear on this page. If a county has not yet uploaded their election results to this website or if you are looking for local election results, please contact the county board of elections. Write-in results are shown in the aggregate. Individual names for write-ins are only published in the official results and only by the State Board if a write-in candidate is a winner.
Check Result Here : https://nyenr.elections.ny.gov/
Please Note:
County Boards of Elections have received a historically high number of absentee ballots for all elections held on June 23, 2020 due to the coronavirus pandemic. Unofficial election night results do not include the results of absentee ballot voting. The canvass of absentee ballots will begin after election day.
Statement on the Unofficial Nature of Election Night Results:
The unofficial election night results displayed on this web site are based on the unofficial results reported to us by each County Board of Elections and as such, are posted on the web as a convenience to the public. New York State Election Law requires a complete recanvass of all votes cast on Election Day and the canvass of all valid absentee, special, and affidavit (provisional) ballots before any election results can be certified.
Once all ballot counting tasks have been completed (usually within 15 days for a primary and within 25 days for a general election), each County Board certifies their respective election results pursuant to and in accordance with the applicable sections of New York State Election Law (see NYS Election Law, Sections 3-222, 9-200, 9-208). Those certifications are then sent to the State Board for aggregation, certification and publication/posting.
|
||||||
| Candidate | Party | Graph (by Candidate) | Percent (by Candidate) | Votes (by Candidate) | ||
|---|---|---|---|---|---|---|
| Pete Buttigieg | DEM |  |
1.55 % | 11,305 | ||
| Amy Klobuchar | DEM | 0.78 % | 5,667 | |||
| Joseph R. Biden | DEM | |
67.47 % | 492,262 | ||
| Tulsi Gabbard | DEM | 0.80 % | 5,816 | |||
| Bernie Sanders | DEM | |
19.07 % | 139,146 | ||
| Michael R. Bloomberg | DEM | |
3.49 % | 25,444 | ||
| Tom Steyer | DEM | 0.19 % | 1,384 | |||
| Michael Bennet | DEM | 0.28 % | 2,054 | |||
| Elizabeth Warren | DEM | |
4.40 % | 32,070 | ||
| Andrew Yang | DEM | |
1.69 % | 12,318 | ||
| Deval Patrick | DEM | 0.29 % | 2,142 | |||
| Total Votes | 729,608 | |||||
|
||||||
| Candidate | Party | Graph (by Candidate) | Percent (by Candidate) | Votes (by Candidate) | ||
|---|---|---|---|---|---|---|
| Pete Buttigieg | DEM | |
1.89 % | 275 | ||
| Amy Klobuchar | DEM | 0.67 % | 98 | |||
| Joseph R. Biden | DEM | |
71.66 % | 10,424 | ||
| Tulsi Gabbard | DEM | 0.63 % | 91 | |||
| Bernie Sanders | DEM | |
18.29 % | 2,660 | ||
| Michael R. Bloomberg | DEM | |
2.03 % | 295 | ||
| Tom Steyer | DEM | 0.12 % | 17 | |||
| Michael Bennet | DEM | 0.08 % | 11 | |||
| Elizabeth Warren | DEM | |
3.31 % | 481 | ||
| Andrew Yang | DEM | |
1.15 % | 168 | ||
| Deval Patrick | DEM | 0.19 % | 27 | |||
| Total Votes | 14,547 | |||||
|
||||||
| Candidate | Party | Graph (by Candidate) | Percent (by Candidate) | Votes (by Candidate) | ||
|---|---|---|---|---|---|---|
| Pete Buttigieg | DEM | |
1.77 % | 205 | ||
| Amy Klobuchar | DEM | 0.53 % | 61 | |||
| Joseph R. Biden | DEM | |
71.94 % | 8,340 | ||
| Tulsi Gabbard | DEM | 0.68 % | 79 | |||
| Bernie Sanders | DEM | |
19.49 % | 2,259 | ||
| Michael R. Bloomberg | DEM | |
1.93 % | 224 | ||
| Tom Steyer | DEM | 0.14 % | 16 | |||
| Michael Bennet | DEM | 0.12 % | 14 | |||
| Elizabeth Warren | DEM | |
2.05 % | 238 | ||
| Andrew Yang | DEM | |
1.06 % | 123 | ||
| Deval Patrick | DEM | 0.29 % | 34 | |||
| Total Votes | 11,593 | |||||
|
||||||
| Candidate | Party | Graph (by Candidate) | Percent (by Candidate) | Votes (by Candidate) | ||
|---|---|---|---|---|---|---|
| Pete Buttigieg | DEM | |
1.77 % | 265 | ||
| Amy Klobuchar | DEM | 0.83 % | 124 | |||
| Joseph R. Biden | DEM | |
70.18 % | 10,499 | ||
| Tulsi Gabbard | DEM | |
1.40 % | 210 | ||
| Bernie Sanders | DEM | |
16.76 % | 2,507 | ||
| Michael R. Bloomberg | DEM | |
3.70 % | 554 | ||
| Tom Steyer | DEM | 0.21 % | 31 | |||
| Michael Bennet | DEM | 0.14 % | 21 | |||
| Elizabeth Warren | DEM | |
2.75 % | 412 | ||
| Andrew Yang | DEM | |
1.94 % | 290 | ||
| Deval Patrick | DEM | 0.31 % | 47 | |||
| Total Votes | 14,960 | |||||